CHECK OUT MY PORTFOLIO:
CHECK
OUT MY PORTFOLIO:
CHECK OUT MY PORTFOLIO:
OKLAHOMA OFFICE OF EDUCATIONAL QUALITY & ACCOUNTABILITY (OEQA)


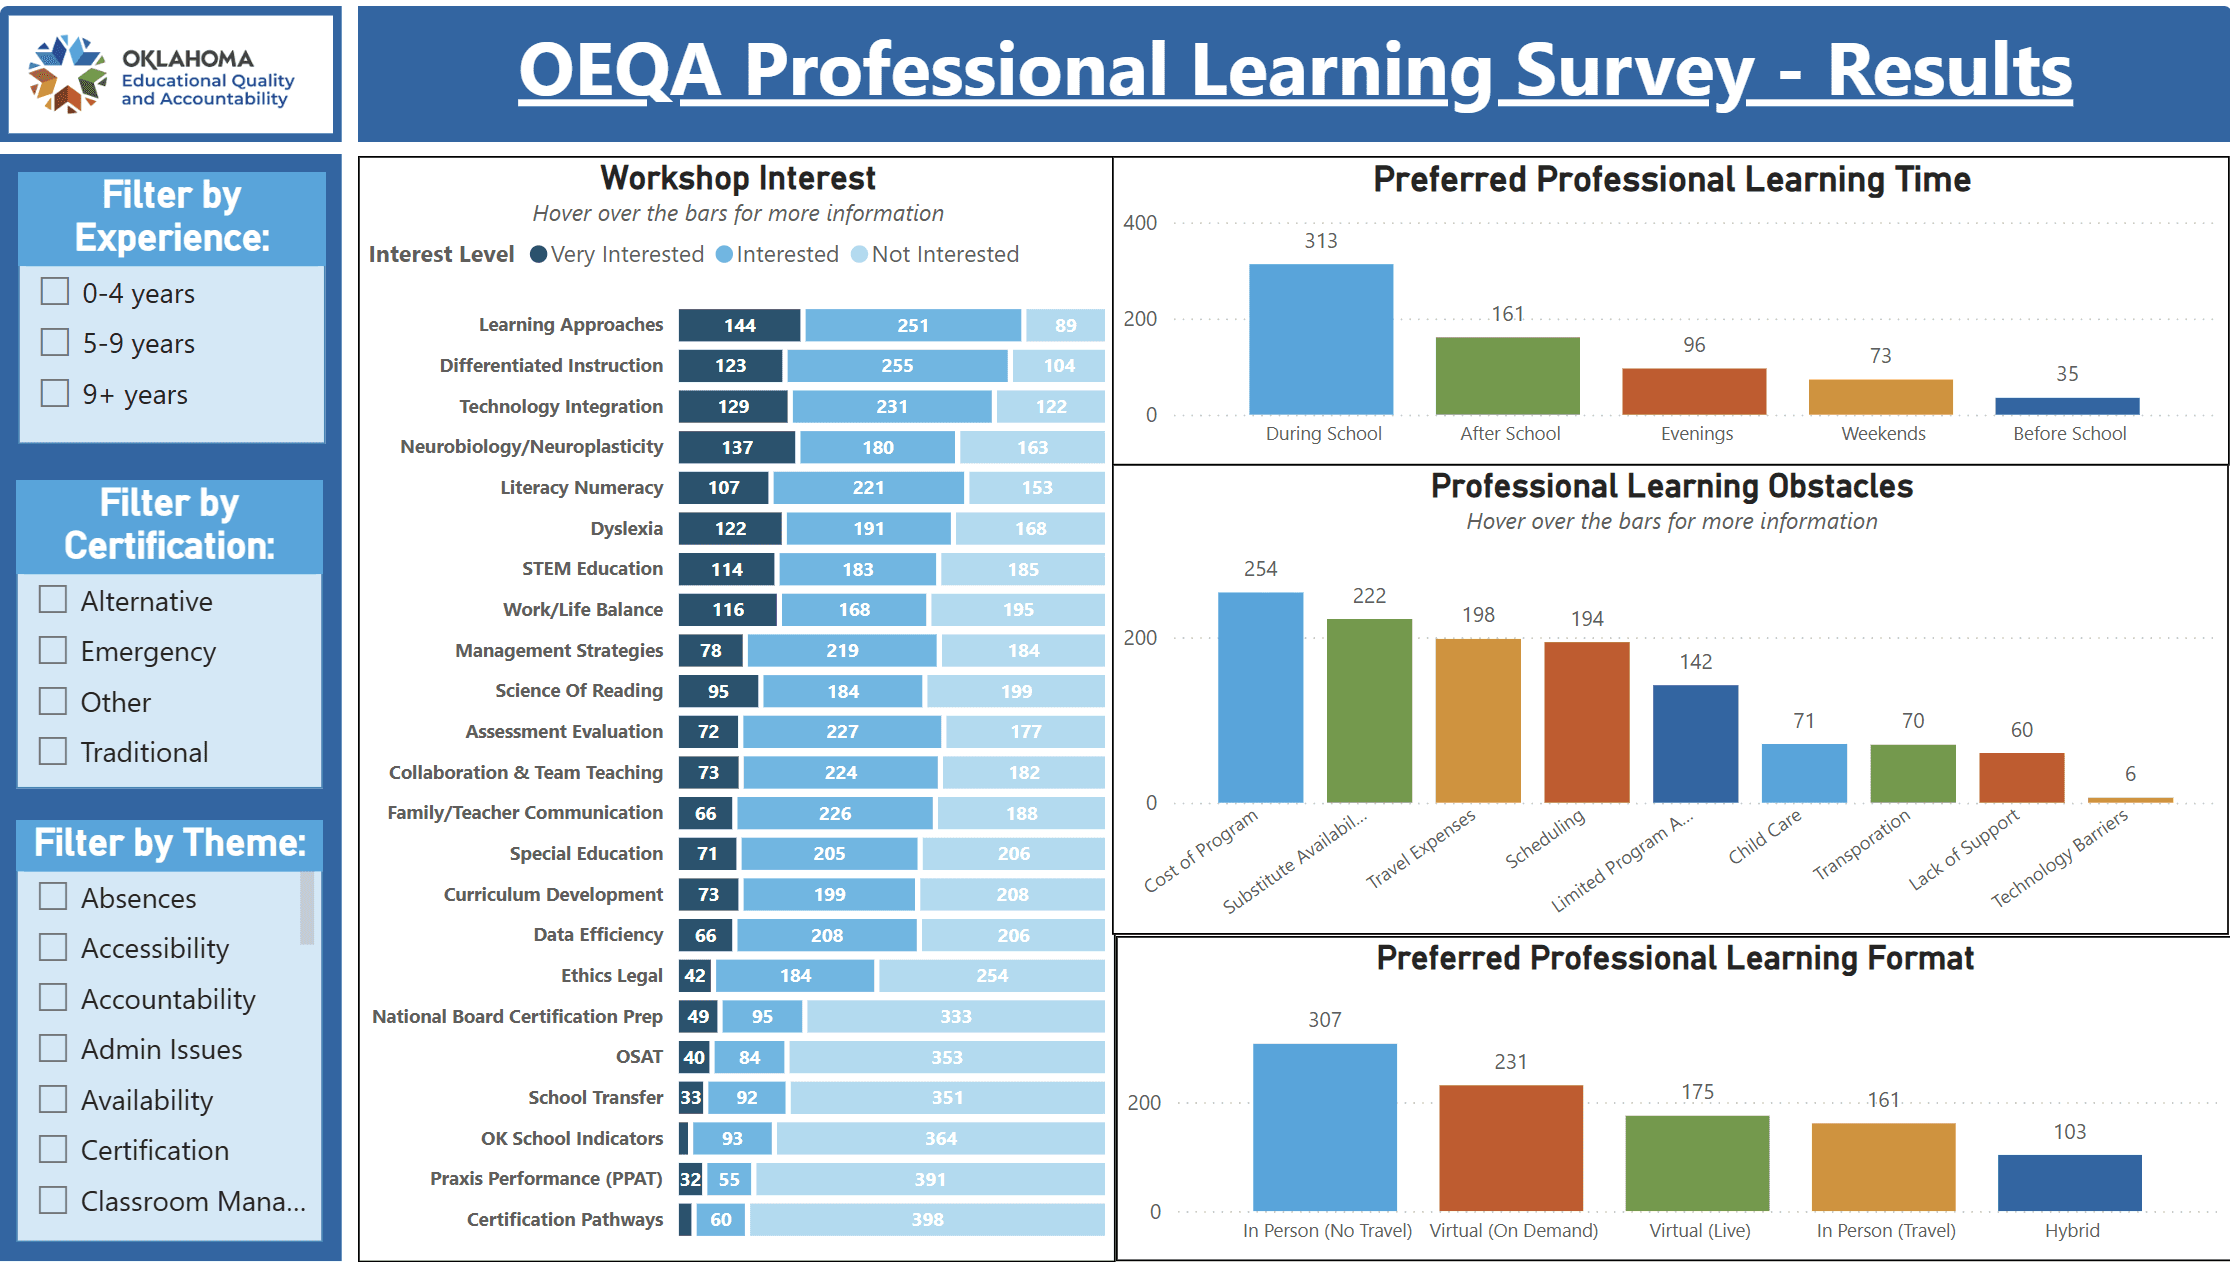
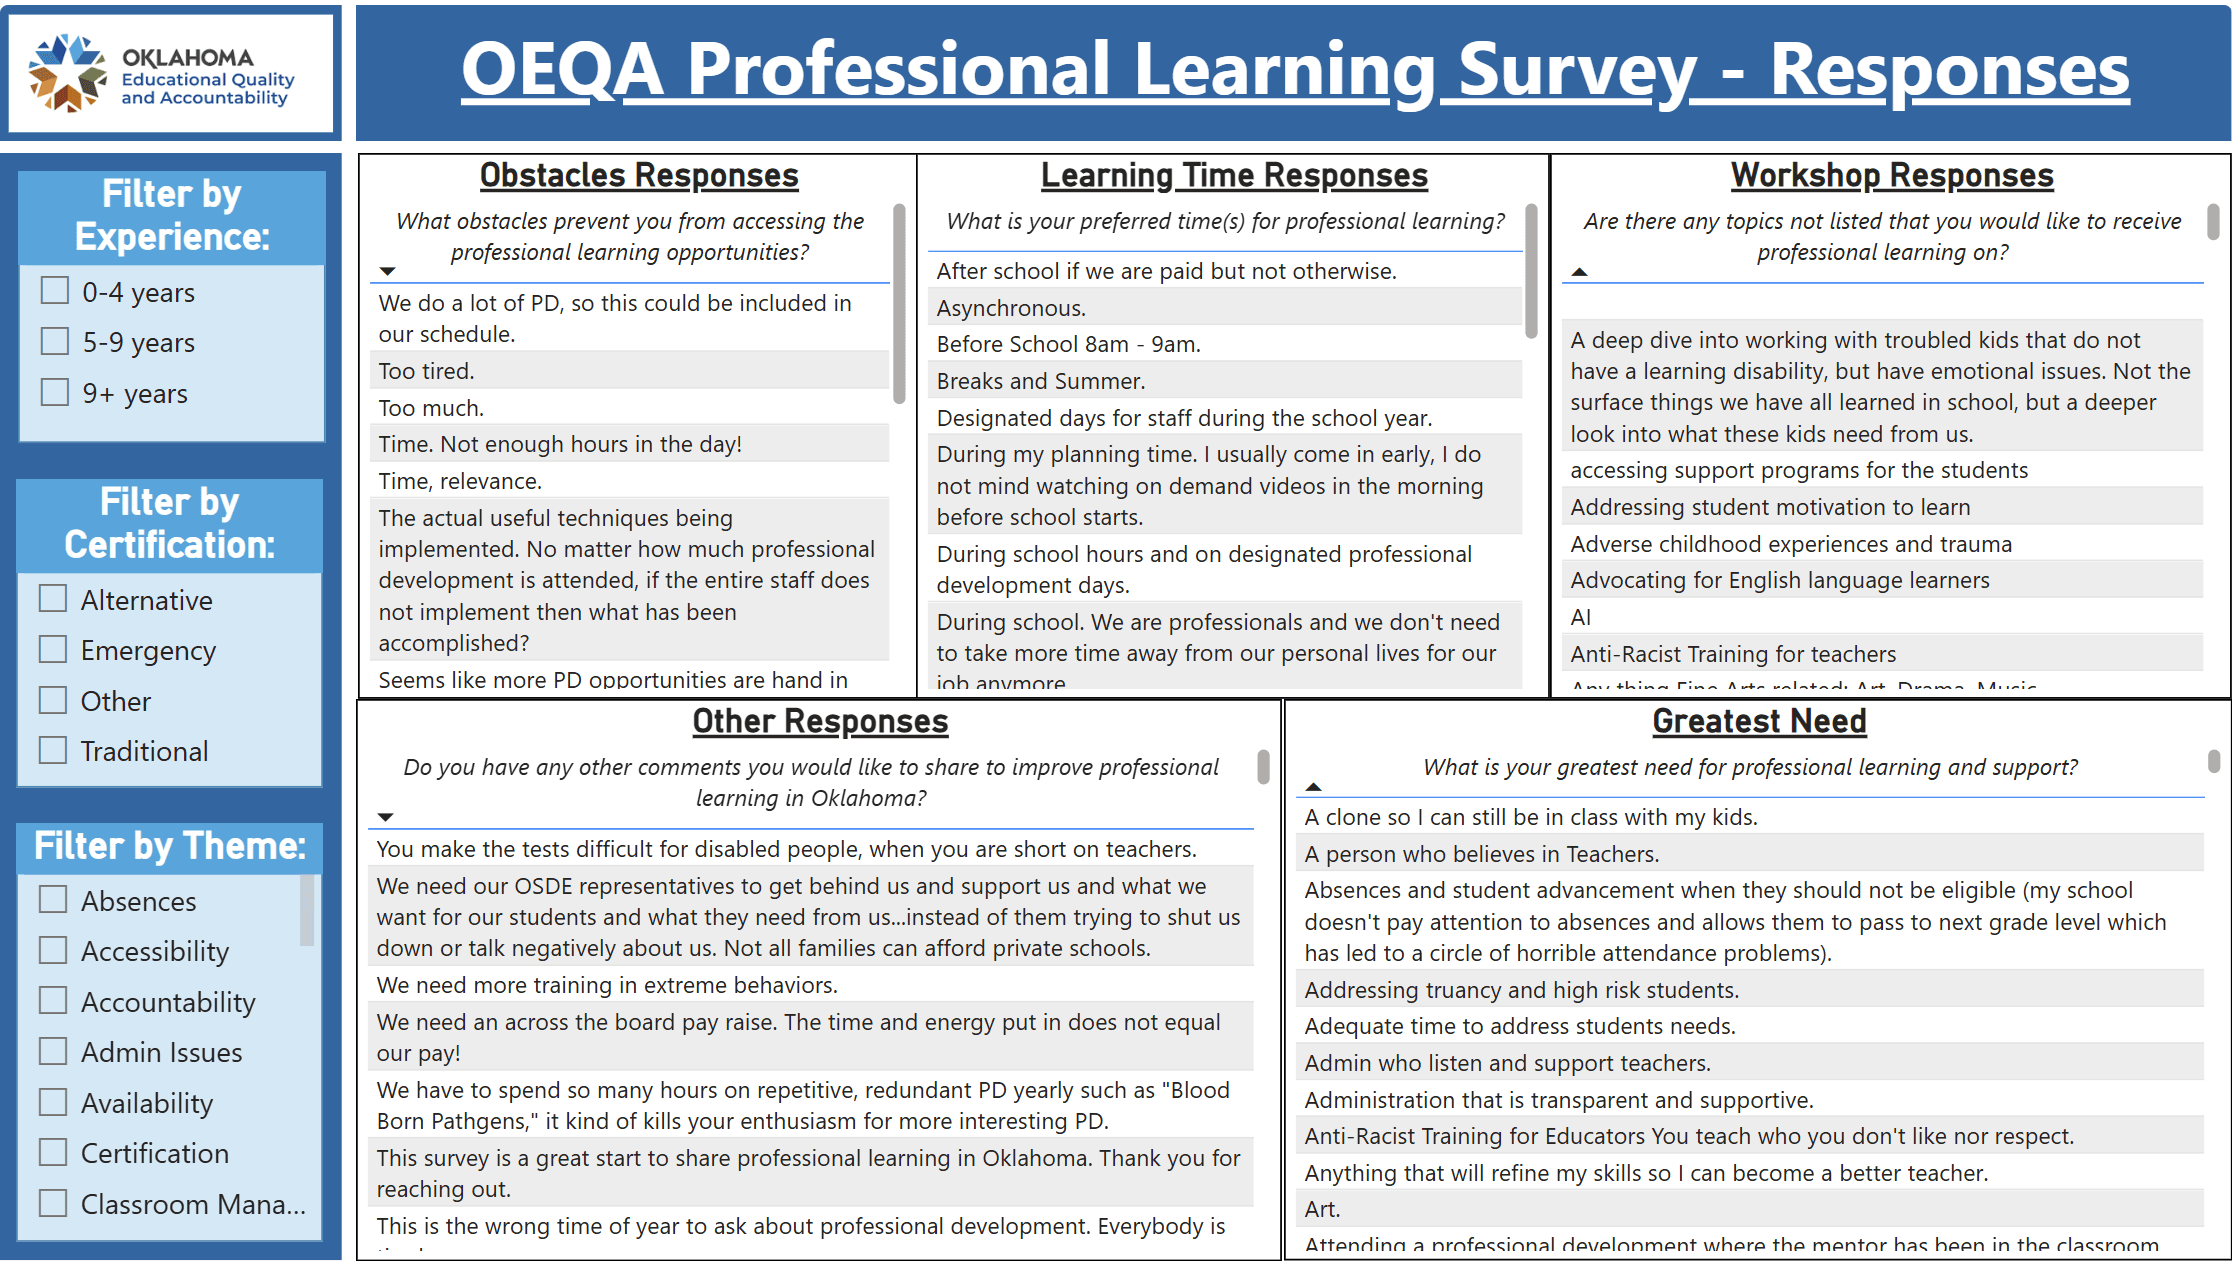
This project involved transforming and analyzing qualitative and quantitative survey data to display results on a public-facing, easy-to-use dashboard. The insights provided by this dashboard were used by OEQA to enhance professional learning for Oklahoma educators. You can find the live dashboard which you can interact with and learn from here.
OKLAHOMA CENTER FOR ADVANCEMENT OF SCIENCE & TECHNOLOGY (OCAST)


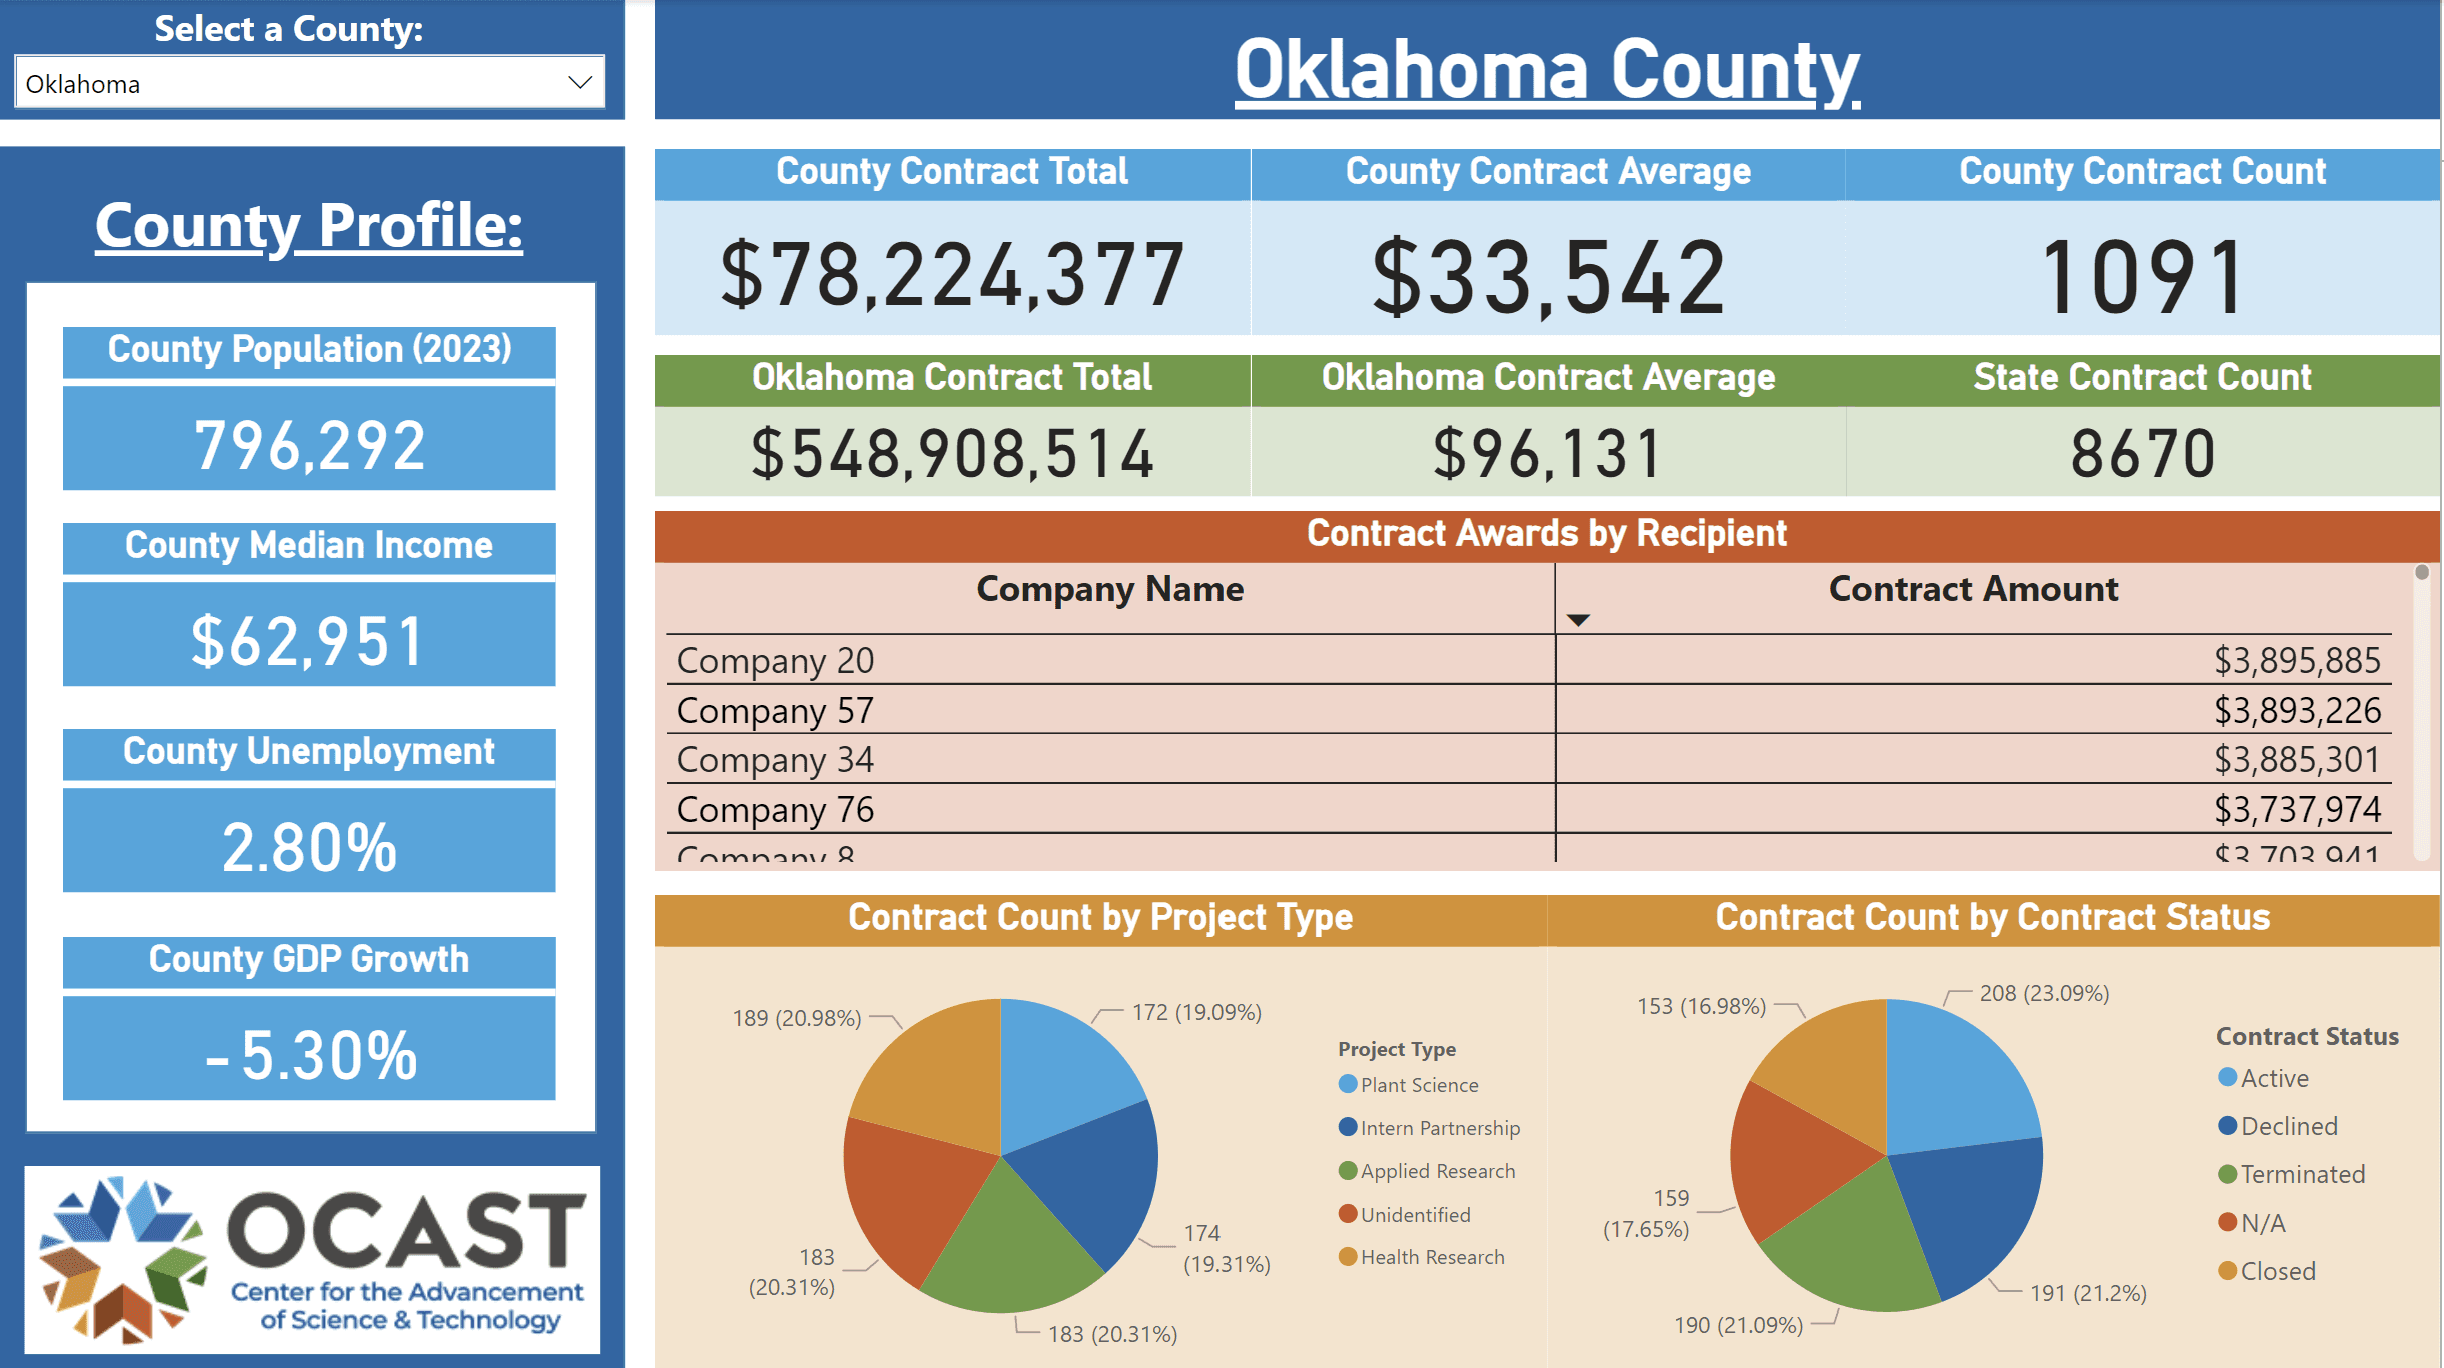
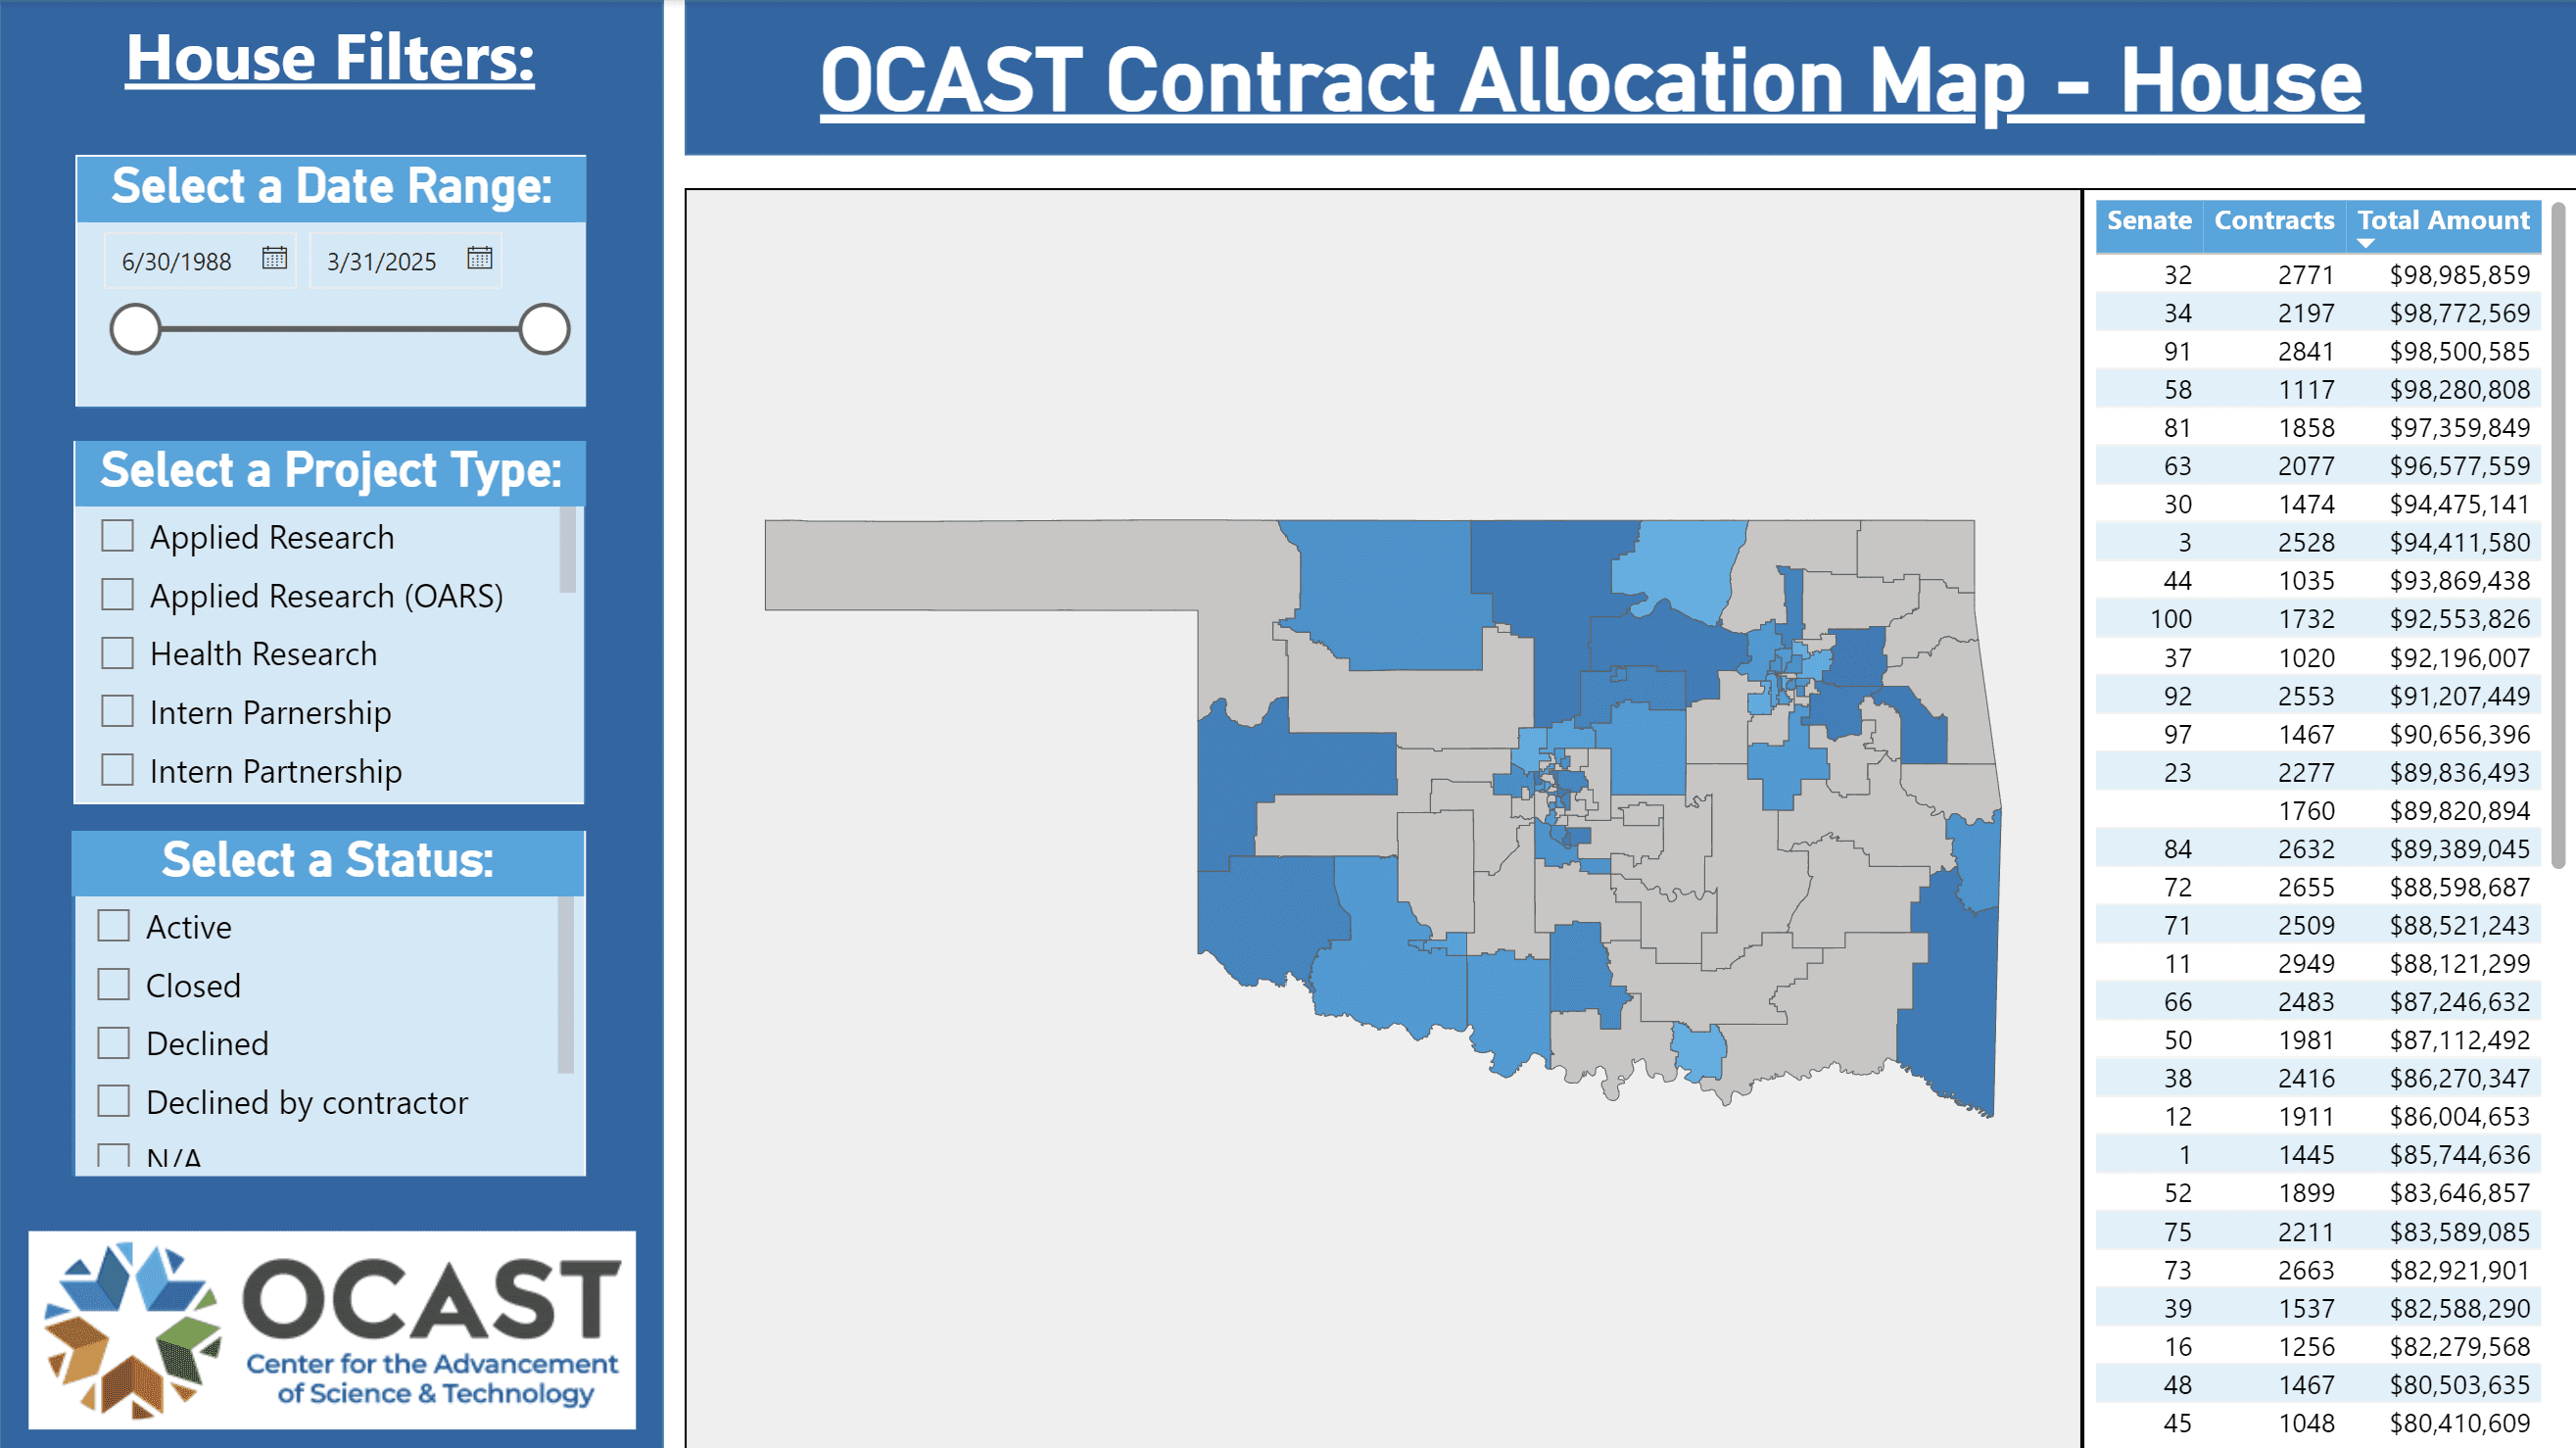
This project consisted of transforming large datasets into actionable data visualizations using Power Query Editor and Power BI. The dashboard provides key insights on contract data integral to the agency and will serve as a tool for stakeholders including agency management and legislators. The data shown in these images are randomly generated and do not represent the actual dataset.
OKLAHOMA OFFICE OF EDUCATIONAL QUALITY & ACCOUNTABILITY (OEQA)


This project involved transforming and analyzing qualitative and quantitative survey data to display results on a public-facing, easy-to-use dashboard. The insights provided by this dashboard were used by OEQA to enhance professional learning for Oklahoma educators. You can find the live dashboard which you can interact with and learn from here.
OKLAHOMA CENTER FOR ADVANCEMENT OF SCIENCE & TECHNOLOGY (OCAST)


This project consisted of transforming large datasets into actionable data visualizations using Power Query Editor and Power BI. The dashboard provides key insights on contract data integral to the agency and will serve as a tool for stakeholders including agency management and legislators. The data shown in these images are randomly generated and do not represent the actual dataset.
OKLAHOMA OFFICE OF EDUCATIONAL QUALITY & ACCOUNTABILITY (OEQA)


This project involved transforming and analyzing qualitative and quantitative survey data to display results on a public-facing, easy-to-use dashboard. The insights provided by this dashboard were used by OEQA to enhance professional learning for Oklahoma educators. You can find the live dashboard which you can interact with and learn from here.
OKLAHOMA CENTER FOR ADVANCEMENT OF SCIENCE & TECHNOLOGY (OCAST)


This project consisted of transforming large datasets into actionable data visualizations using Power Query Editor and Power BI. The dashboard provides key insights on contract data integral to the agency and will serve as a tool for stakeholders including agency management and legislators. The data shown in these images are randomly generated and do not represent the actual dataset.
© NICK SAYEGH SOLUTIONS & CONSULTING CO. 2024
© NICK SAYEGH SOLUTIONS & CONSULTING CO. 2024
© NICK SAYEGH SOLUTIONS & CONSULTING CO. 2024